Displaying Results
NOTE: We assume that all analyses are done in radiologic conventions (right is left).
Additional methods for display are described below.
- Display your results on multiple slices of a template MRI
- Overlaying results on a patients own MRI
- Make 3D rendering of Results
- Overlaying Subtract Processing on a patients own MRI
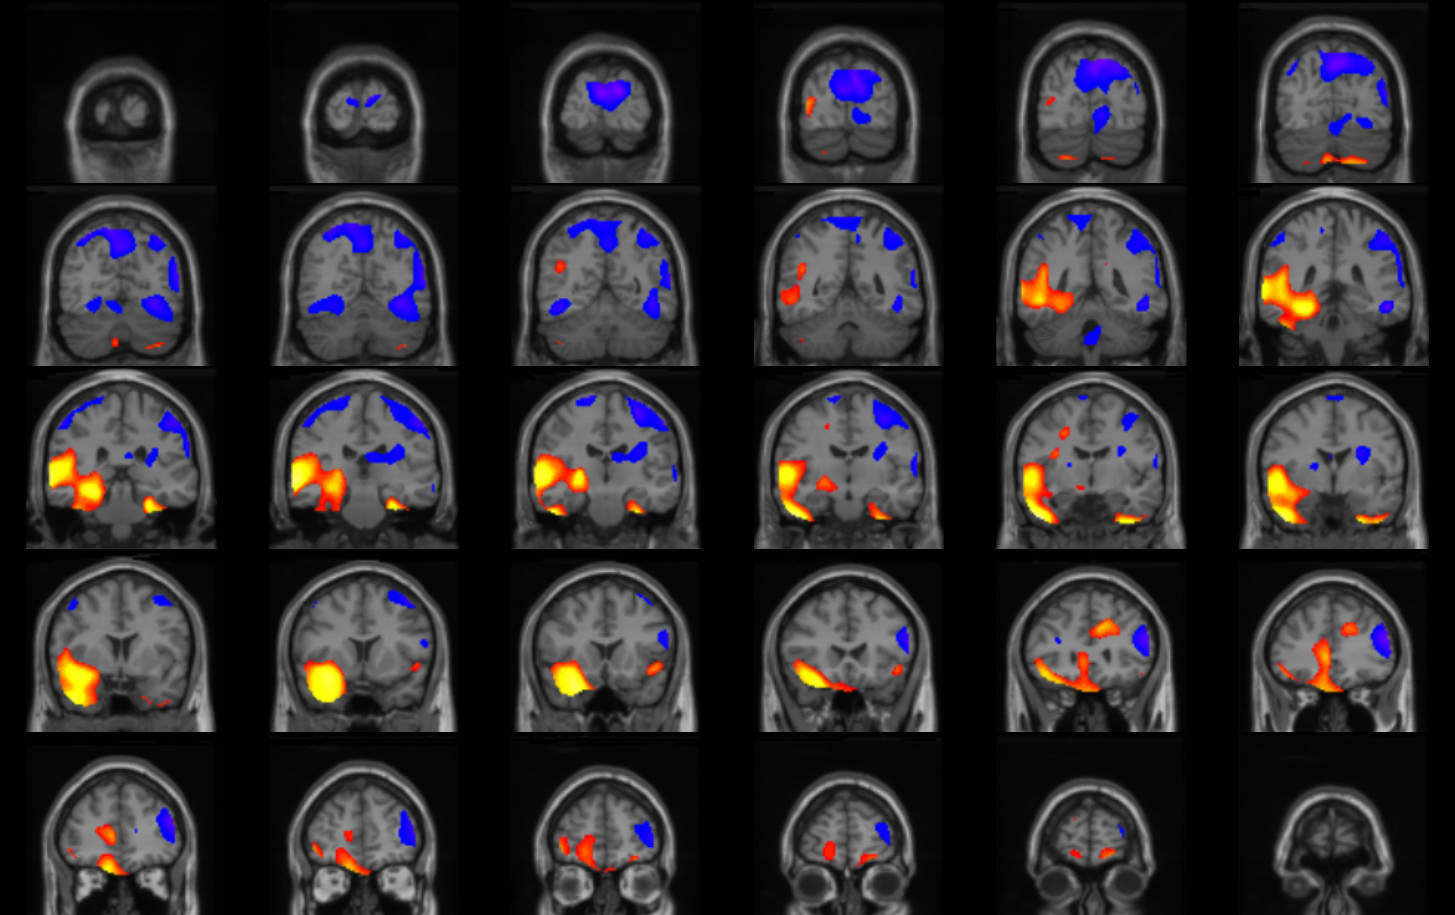
Display your results on multiple slices of a template MRI
Create an overlay of the Perfusion Blobs onto the MNI Template MRI.
Figure shows the Perfusion Blobs overlayed on a template MRI.
 |
- Highlight the MNI Template MRI node on the Data Tree Manager.
Then, click the Set Space/Anatomical Image button located to the right.
- Highlight the Perfusion Blobs node on the datatree and click the Set Functional Image button.
- Click the Reslice Images button locate under the Set Space/Anatomical Image button.
- In the Overlays Tab of the Data Tree Manager (locate below the
Reslice Images button), set the low threshold to zero and click the Create Overlay button.
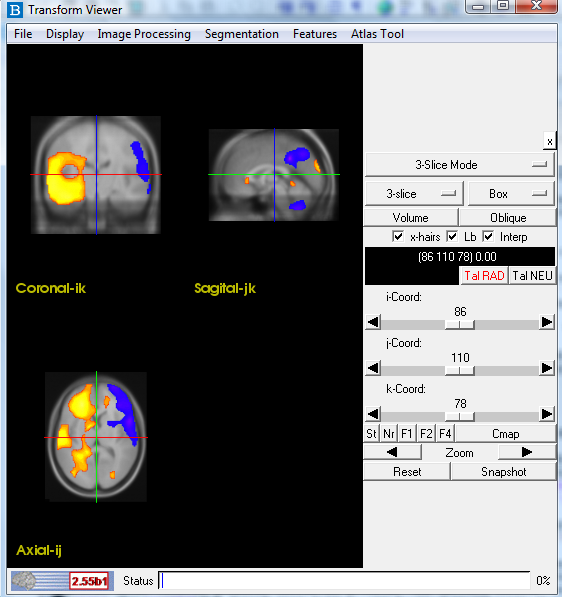
- The transform viewer should now show the Perfusion Blobs overlayed on to the Template MRI.
- On the Data Tree Manager menu, select "Viewers" and then "Simple Viewer."
The Simple Viewer will now pop up.
- In the Simple Viewer main menu, select "Display" and then "Grab From Transform Viewer."
- Using the slide bar on the right of the Simple Viewer, adjust the number
of rows and columns to display desired number of coronal slices. Generally 6 columns and 7 rows works well.
Finally adjust the increment of the slices. Generally showing every second slice (an increment of two) works well.
- A *.jpg picture (like example shown above) can be saved using the Snapshot button on the bottom right corner of the application
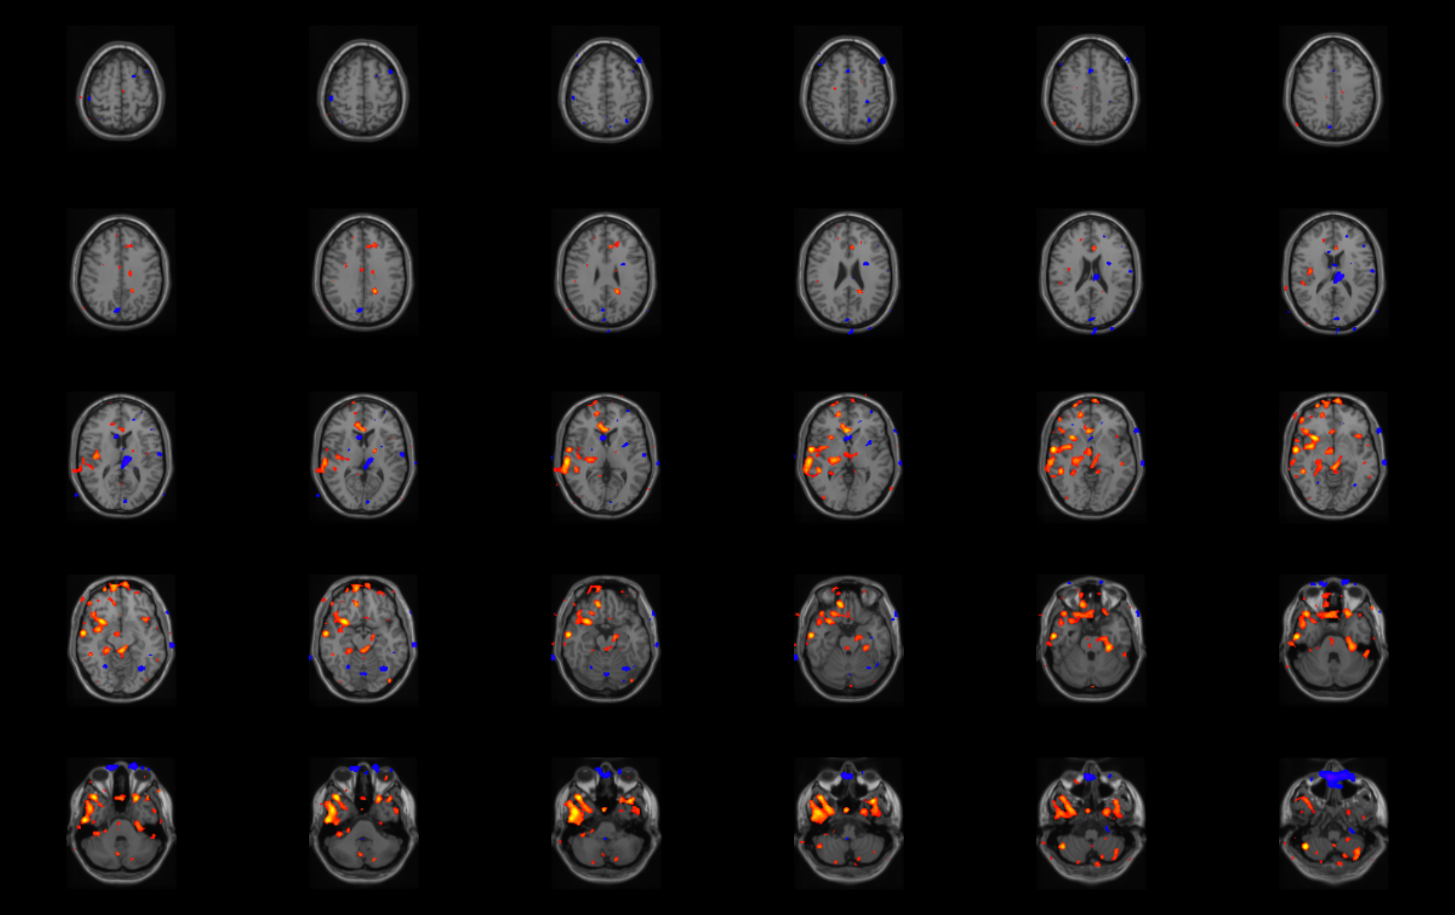
Overlaying results on a patients own MRI
Create an overlay of the Perfusion Blobs onto the Patients own MRI. These steps are the same as above with just switching out the template MRI for the patient's MRI.
- Highlight the patient's MRI node on the Data Tree Manager.
Then, click the Set Space/Anatomical Image button located to the right.
- Highlight the Perfusion Blobs node on the datatree and click the Set Functional Image button.
- Click the Reslice Images button locate under the Set Space/Anatomical Image button.
- In the Overlays Tab of the Data Tree Manager (locate below the
Reslice Images button), set the low threshold to zero and click the Create Overlay button.
- The transform viewer should now show the Perfusion Blobs overlayed on to the patient's MRI.
- On the Data Tree Manager menu, select "Viewers" and then "Simple Viewer."
The Simple Viewer will now pop up.
- In the Simple Viewer main menu, select "Display" and then "Grab From Transform Viewer."
- Using the slide bar on the right of the Simple Viewer, adjust the number
of rows and columns to display desired number of coronal slices. Generally 6 columns and 7 rows works well.
Finally adjust the increment of the slices. Generally showing every third slice (an increment of three) works well.
- A *.jpg picture can be saved using the Snapshot button on the bottom right corner of the application
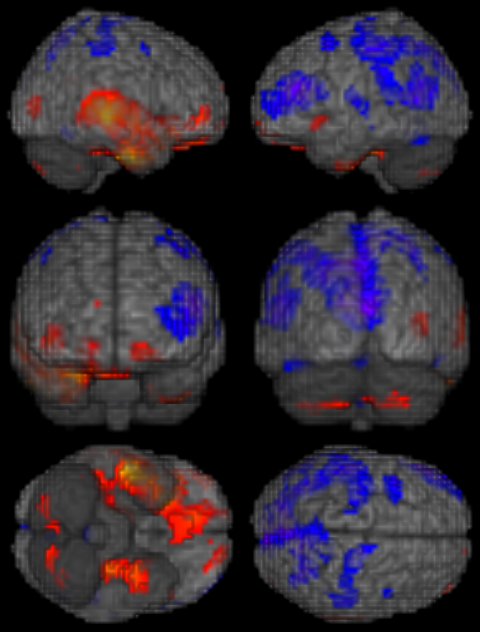
Make 3D rendering of Results
- Highlight the MNI Template MRI stripped (no skull) node on the Data Tree Manager.
Then, click the Set Space/Anatomical Image button located to the right.
- Highlight the Perfusion Blobs node on the datatree and click the Set Functional Image button.
- Click the Reslice Images button locate under the Set Space/Anatomical Image button.
- In the Overlays Tab of the Data Tree Manager (locate below the
Reslice Images button), set the low threshold to zero and click the Create Overlay button.
- The transform viewer should now show the Perfusion Blobs overlayed on to the Template MRI stripped.
- In the transform viewer, change the top list box on the right from "3-Slice Mode" to "3D Only".
- Next change the list just below from "3-slice" to "Volume".
- Now you rotate the brain to any 3D orientation by click on the brain and moving the mouse.
- A *.jpg picture (like example shown above) can be saved using the Snapshot button on the bottom right corner of the application
- The figure below can be made by combining six different 3D Snapshots in a program like Paint or Photoshop.
Overlaying Subtraction Processing on a patients own MRI
Create an overlay of the Subtraction Processing onto the Patients own MRI. These steps are the same as above with just switching
out the Perfusion Blobs for the Subtraction Processing results.
- Highlight the patient's MRI node on the Data Tree Manager.
Then, click the Set Space/Anatomical Image button located to the right.
- Highlight the Subtraction Processing result node on the datatree and click the Set Functional Image button.
- Click the Reslice Images button locate under the Set Space/Anatomical Image button.
- In the Overlays Tab of the Data Tree Manager (locate below the
Reslice Images button), adjust the low threshold to a value that shows only the one large blob of hyperperfusion.
Generally a value of 25 works well. Although this may value may be different for different patients.
Finally, click the Create Overlay button.
- The transform viewer should now show the Subtraction Processing overlayed on to the patient's MRI.
- On the Data Tree Manager menu, select "Viewers" and then "Simple Viewer."
The Simple Viewer will now pop up.
- In the Simple Viewer main menu, select "Display" and then "Grab From Transform Viewer."
- Using the slide bar on the right of the Simple Viewer, adjust the number
of rows and columns to display desired number of coronal slices. Generally 6 columns and 7 rows works well.
Finally adjust the increment of the slices. Generally showing every third slice (an increment of three) works well.
- A *.jpg picture can be saved using the Snapshot button on the bottom right corner of the application
Back to Analysis Details
||
Jump to Top
||
Forward to Interpreting Results