Sample Analysis
Results are shown here for ISAS analysis and RView analysis of a sample patient, as described in Instructions.
This is Patient #2 from (McNally et al., 2005).
The results you obtain running ISAS on the sample patient should be identical to the results displayed on this page.
FAQ: How "identical" is "identical"?
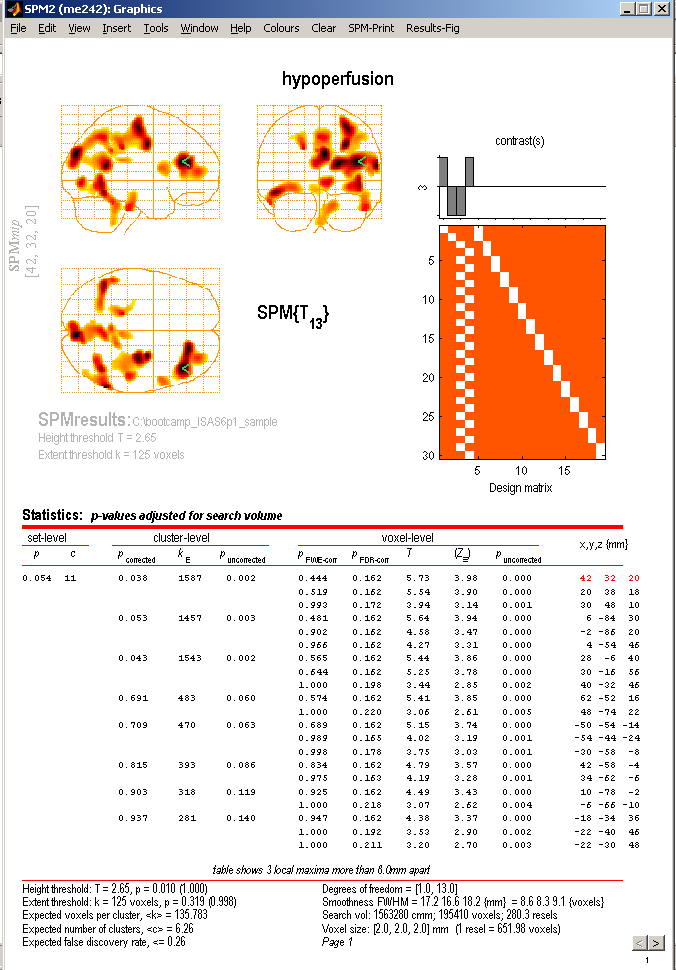
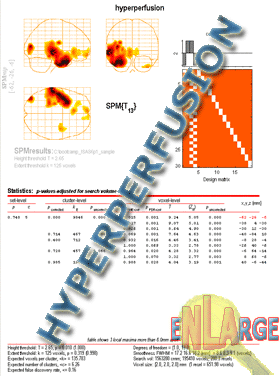
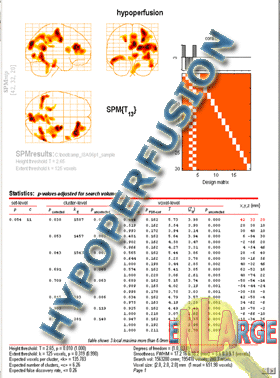
ANS: All clusters displayed in SPM Hyperperfusion and Hypoperfusion windows should be the same as shown here,
and the statistics tables should be the same as shown here, with all the same clusters listed at the same significance levels,
k values, and locations. Values may be off by a very small amount (less than ~5 voxels) in the table, but if the analysis
was implemented correctly, then all the same clusters should be listed, and should appear identical to the glass brains
shown here.
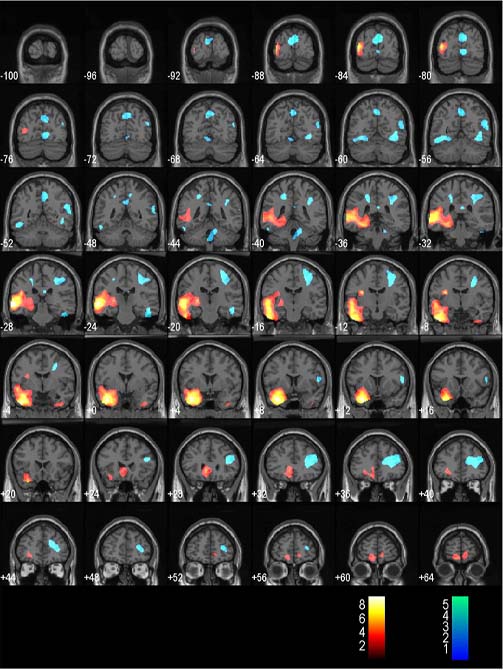
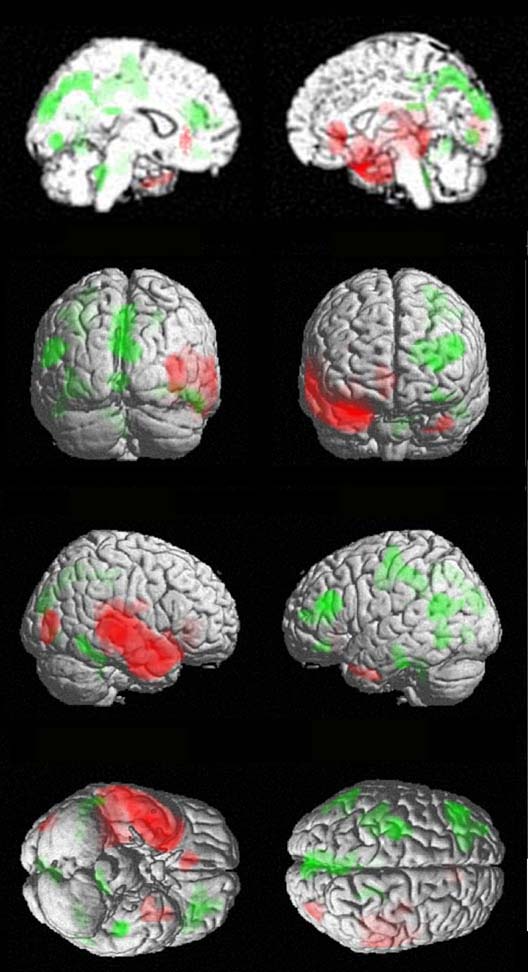
Glass Brains with Significant Volume Clusters (Click to Enlarge)
Coronal Slices on Template Brain
3D Renders
- Midsagittal views: SPM99 template
- All other views: SPM2 template
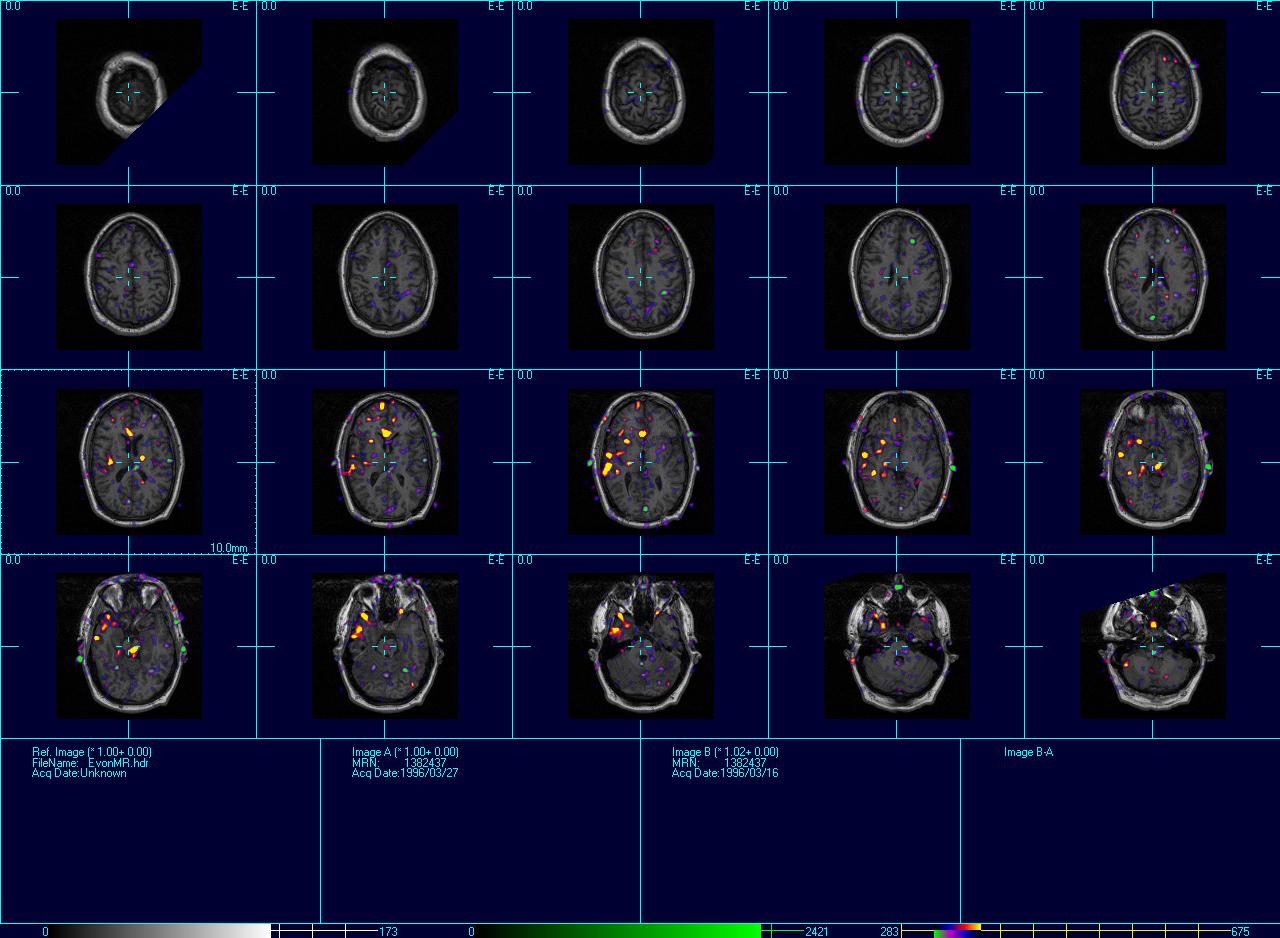
RView Results for Patient#2
Contact Us
||
Jump to Top
||
Return to ISAS Home